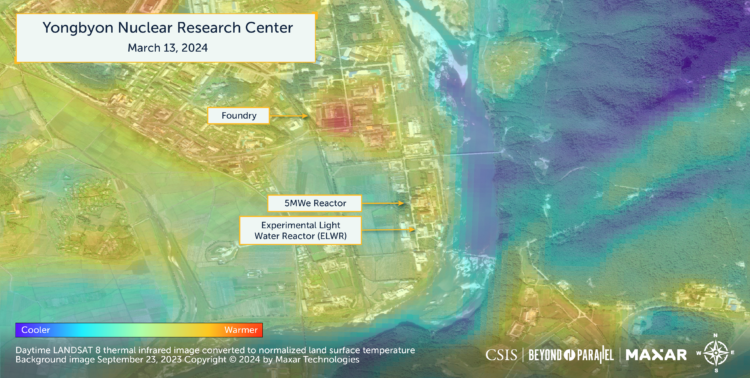
Enhancing Understanding of Yongbyon Through Thermal Imagery: Part 2

Key Findings
- Thermal infrared (TIR) analysis via LANDSAT 8 and 9 imagery over two years provides key insights into Yongbyon nuclear facilities’ operations, highlighting the intricate strengths and limitations of thermal imagery for operational assessment.
- This part of the series builds upon the foundational methodology and findings presented in Part 1, offering a deeper dive into the operational nuances of the 5MWe Reactor and the Experimental Light Water Reactor.
- The analysis highlights instances of strong thermal patterns corresponding with known operational periods, thereby supporting the utility of TIR analysis in confirming reactor activity. It also observes weak or undetectable patterns during some known operational times, cautioning against relying solely on thermal imagery and advocating for an all-source intelligence approach for precise operational assessments.
- Significantly, the research finds no “false positives” (strong thermal signals during non-operational phases), suggesting the reliability of TIR analysis for operational verification. However, the presence of “false negatives” (weak signals during operational phases) underscores the critical need for supplementary intelligence to support TIR findings.
This report is the second of a three-part series that discusses thermal infrared (TIR) analysis using LANDSAT 8 and LANDSAT 9 imagery taken over each month from January 2022 to March 2024. By comparing the thermal analysis with what is already known about the level of operation at the Yongbyon Nuclear Research Center during the studied period, the report provides a reflection on whether TIR analysis shows clear indicators of operation over the key areas at Yongbyon. By doing so, the report can offer not only an understanding of how TIR analysis can be used in the future but also provide clear words of caution of overreliance on infrared analysis to reach conclusions concerning the operational status of Yongbyon’s key facilities.
For an overview of the findings and methodology of the study, please see part one.
As part two of the series, this report focuses on the central section of the Yongbyon Nuclear Research Center, specifically on the 5MWe Reactor and the Experimental Light Water Reactor (ELWR).
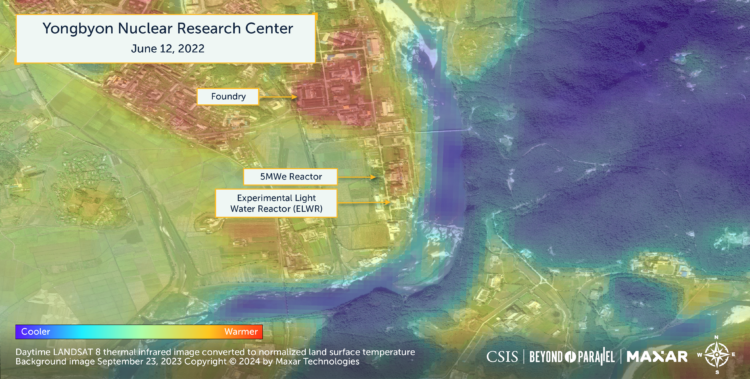
Normalized land surface temperature over this area highlights both the strengths and weaknesses of relying on TIR analysis to determine the operational status of the reactors. Analysis of 29 separate sets of imagery suggests that the findings can be separated into four general categories:
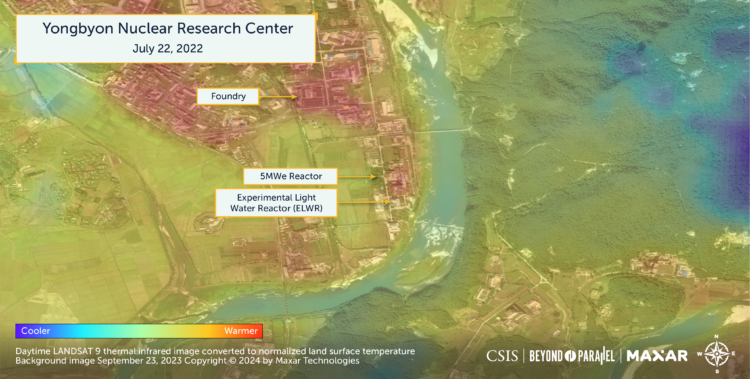
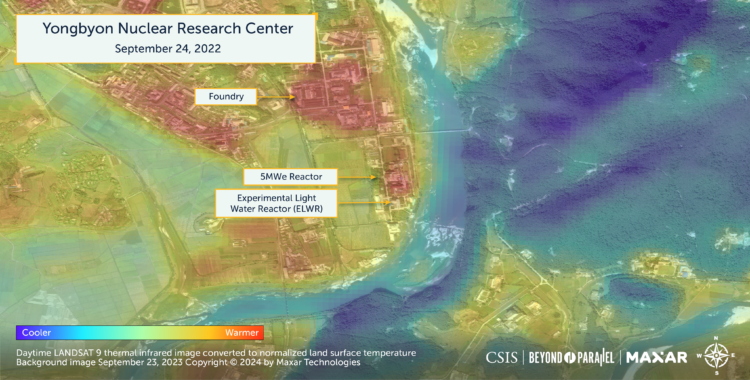
- Strong thermal patterns were observed when the facilities were known to have been operating;
- No distinguishable thermal patterns were observed when the facilities were known to have had interruptions;
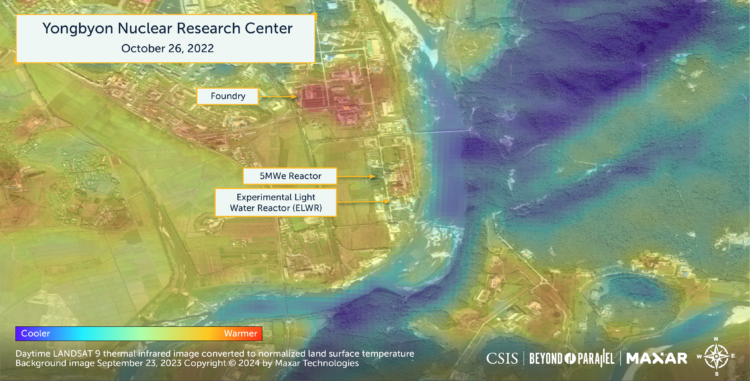
- Weak thermal patterns were observed when the facilities were known to have been operating; and
- No distinguishable thermal patterns were observed when the facilities were known to have been operating.
Each case will be discussed in greater detail below. However, the four cases further emphasize that relying solely upon commercial thermal imagery analysis alone is not sufficient to confidently conclude operational status. As for many other types of analysis, it is important that such a conclusion be undertaken with the context of a combined-intelligence approach.
Despite these words of caution, it is notable that out of the months studied, there were no instances where strong thermal patterns were observed during a time when facilities were known to not have been operating. In other words, although there were some instances of “false negatives” (weak thermal patterns when the facilities were reportedly operating), there were no instances of “false positives” (strong thermal patterns when facilities were reportedly not operating). Thus, when TIR analysis is conducted in the future and a strong thermal pattern is observed, even without additional information on the immediate operational status, it would be reasonable to conclude that the reactors are likely operational.
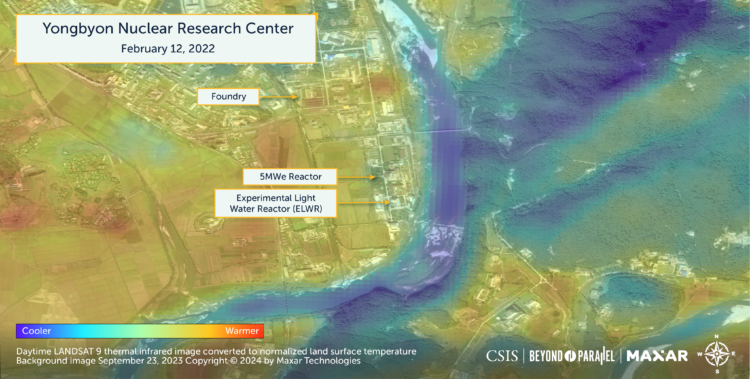
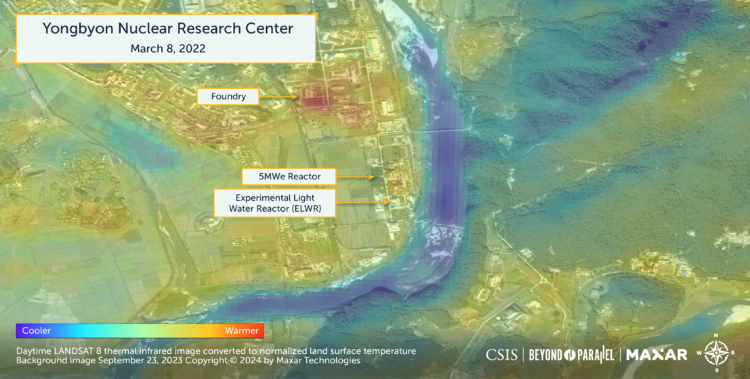
What follows is an exploration of the four cases presented above. While each case includes a few months’ analyses as examples, the entire collection of TIR analyses in chronological order is offered at the end of the report.
Strong Thermal Patterns During Operation
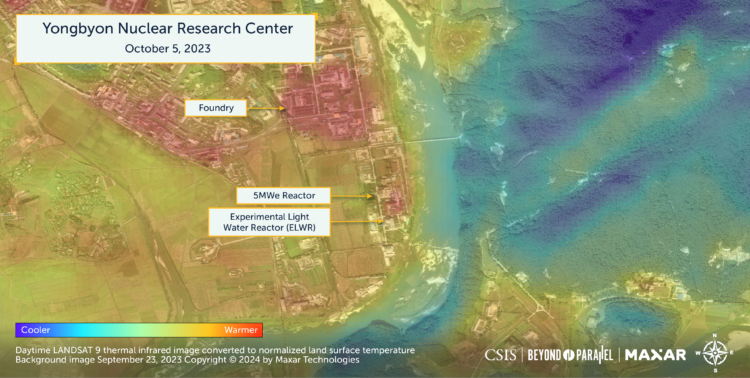
Out of the months studied, the following months displayed strong thermal patterns at either or both 5MWe Reactor and the ELWR: April 2022, June 2022, July 2022, September 2022, December 2022, July 2023, October 2023, and December 2023. Interestingly, the patterns also vary in type. In certain stances, the strong thermal patterns are observed directly over the 5MWe Reactor and/or the ELWR, and in others, the thermal pattern in the water shows that cooling water has been discharged from the reactors. One such example is the TIR analysis of a LANDSAT 9 image taken on July 22, 2022. Normalized surface temperature over the 5MWe Reactor showed that the area was distinguishably higher in temperature compared to the mean value across the area studied. The 5MWe reactor has been known to be operational during this time period according to a UN PoE report, as well as 38 North analysis of multispectral imagery taken on the same day, July 22, 2022, which showed cooling water discharge.1

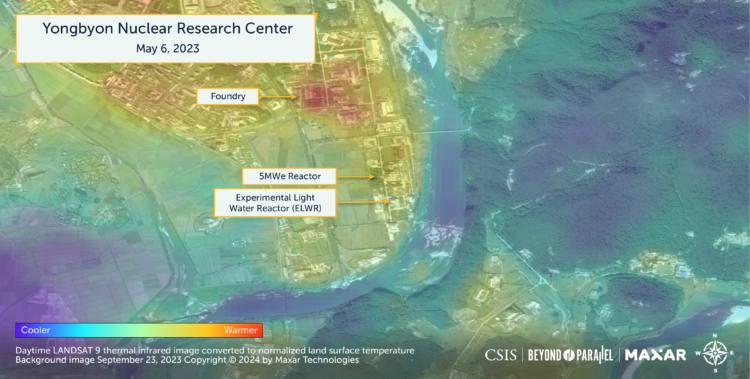
Another example of a strong thermal pattern over the 5MWe reactor when it was known to have been operating is on July 1, 2023. Similar to the previous year’s imagery, although the neighboring foundry displays the strongest thermal pattern, the temperature over the 5MWe reactor was also noticeably above average. The United Nations Panel of Experts assesses the reactor to have been operational during this month.2

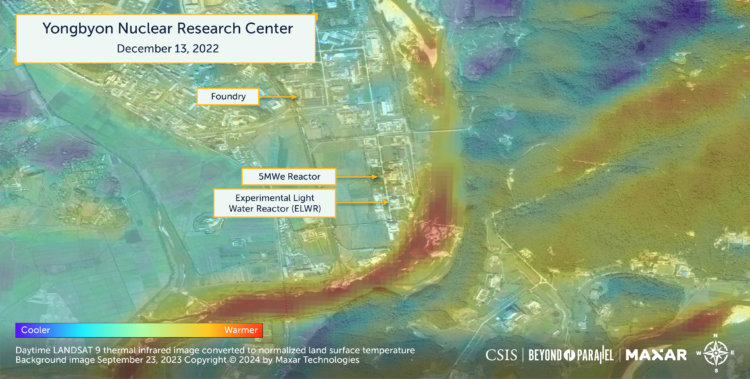
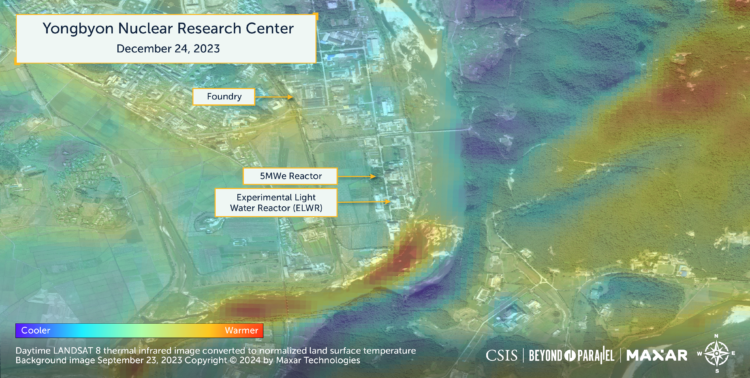
In the months of December 2022 and December 2023, thermal imagery show strong thermal patterns not only over the reactors, but also within the Kuryong River (Kuryong-gang) at and downstream of the cooling water discharge point.


The elevated temperature of the river’s waters downstream of the reactors indicates that warm water was likely being discharged from either the 5MWe reactor or the ELWR discharge pipes—an indication of reactor operations. Although LANDSAT resolution cannot distinguish between the two reactors, the operational status of the reactors is further supported by other sources. The UN PoE assess the 5MWe reactor to have been operational in December 2022, and both reactors to have been operational in December 2023.3 Water discharge from the 5MWe reactor’s discharge pipe was observed in an Airbus imagery taken six days before, on December 18, 2023.4 Additionally, water discharge from the ELWR pipe is observed in multispectral imagery on January 23, 2024, just a few weeks after the date of the TIR image.5
These examples show instances where strong and distinguishable thermal patterns were observed during time periods when the reactors were known or assessed to have been operating, highlighting that TIR analysis can serve to confirm similar assessments in the future. However, it should be noted that other factors may, at times, affect the river water temperature. For example, lower water levels observed at certain locations along the Kuryong River during winter months may either expose or bring rocks and sand in the riverbed closer to the surface, where they are more readily heated up by the sun and display greater surface temperature.
Weak or Indistinguishable Thermal Patterns During Interruptions
Conversely, in April 2023 and September 2023—in months where interruptions or a halt in operation reportedly took place—weak or indistinguishable thermal patterns were observed.
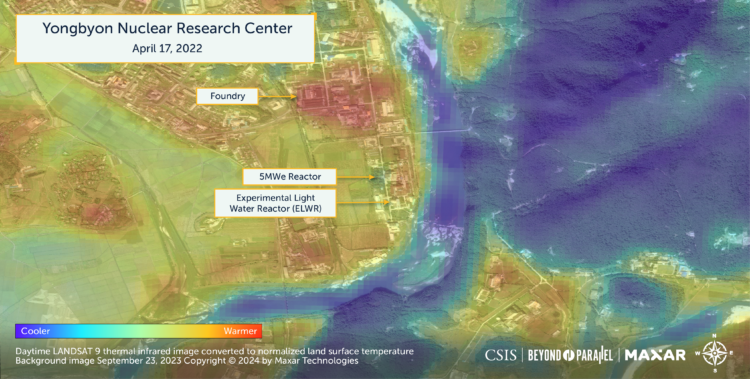
In April of 2022, the UN PoE assess there to have been an interruption of 5MWe operations in the middle of the month.6 Multispectral imagery analysis indicates that water discharge from the reactor stopped by early April and resumed on April 12 but stopped again on April 20.7 Weaker thermal pattern over the reactors in the TIR image from April 17 suggest that the reactor was not in operation at a capacity observed in other months’ where stronger and more distinguishable thermal patterns are observed.
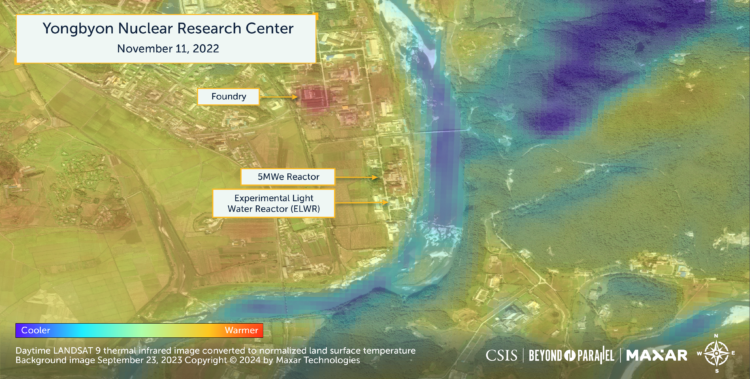
In another instance, on November 11, 2022, weak thermal patterns were observed over the 5MWe reactor. Although multispectral imagery from November 2, 2022, showed water from the discharge pipe, which suggested operations, by just nine days later, TIR analysis lacked a strong indicator of activity. This observation is further supported by the UN PoE, which assessed that there was an interruption to the operation of the 5MWe reactor in mid-November.8

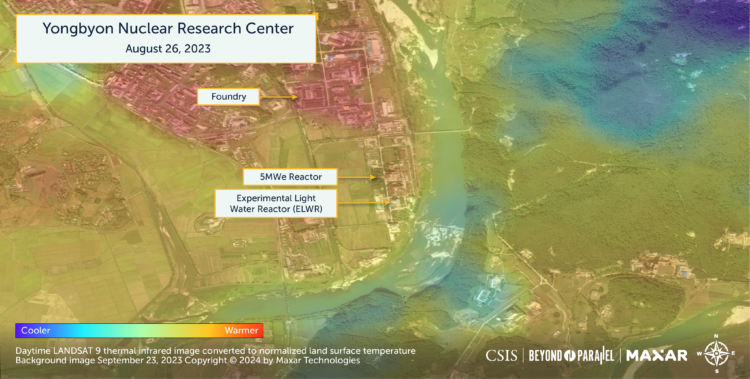
Analysis of TIR imagery taken on September 27, 2023, show an instance where there are no distinguishable thermal patterns over the 5MWe reactor, again when the 5MWe reactor has been known have experienced an interruption in operations. Although the reactor displays temperatures hotter than other areas of the area such as the wooded valleys to the east, the temperature is not distinguishable compared to the surrounding fields. In comparison, the foundry shows a clear and distinguishable thermal pattern.
The UN PoE assesses an interruption of operations at the 5MWe reactor to have occurred sometime between mid-September and early October, which the TIR image falls in between.9 Additionally, American and South Korean intelligence officials reportedly stated that operations were suspended at the reactor in late September.10

Weak or No Thermal Patterns During Operation
The limitation of LANDSAT TIR analysis is highlighted in these third and the fourth cases, when either weak or no distinguishable thermal patterns were observed over the reactors during times when one or both reactors were known to have been operating. There are numerous reasons for this; for example, the operation may have been at a very low level which caused minimal thermal signature.
This emphasizes the need to be cautious in future thermal imagery analysis – that is, to not easily dismiss the possibility of operation when weak or no thermal patterns are observed. Rather, it will be important to collect other sources of information for a combined-intelligence approach. Conversely, this can mean that when LANDSAT imagery does show thermal patterns, it can be reasonably concluded that there is a strong enough emission of heat over the area caused from significant activity.
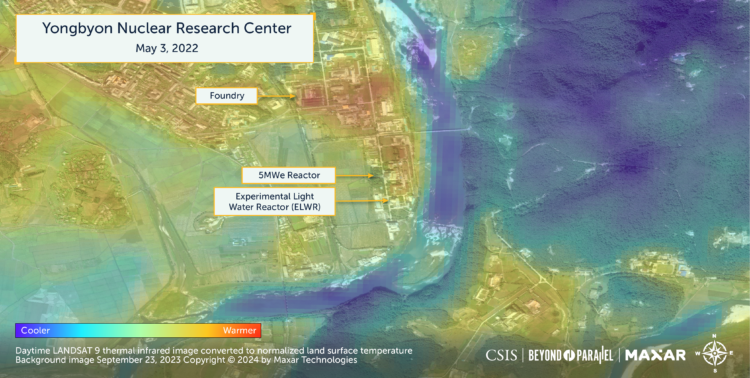
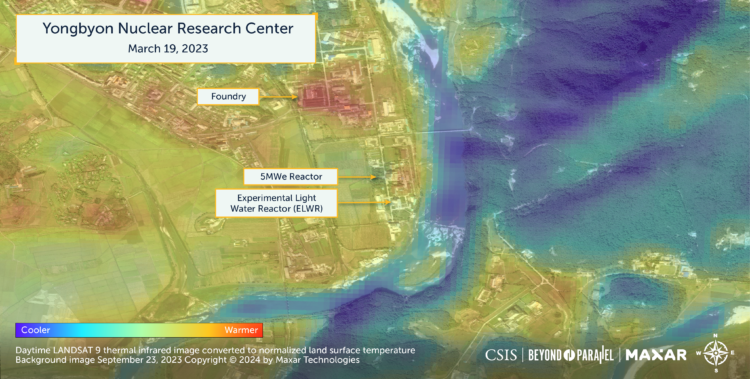
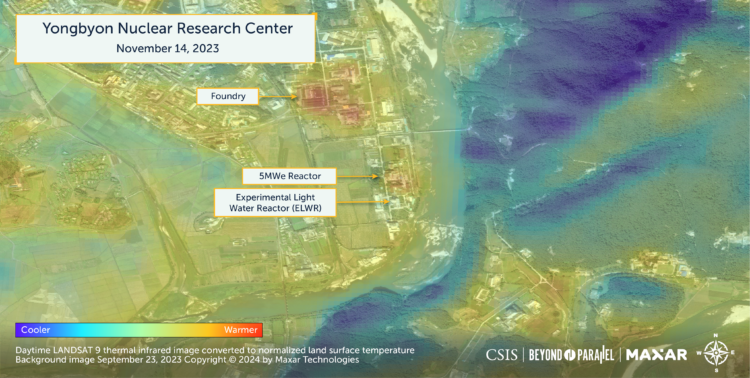
In the months of January 2022, May 2022, August 2022, October 2022, March 2023, November 2023, and January 2024, only weak thermal patterns were observed over the 5MWe reactor and/or the ELWR reactor. For example, image from January 11, 2022, show very weak thermal patterns over the 5MWe reactor and no distinguishable patterns over the ELWR. The UN PoE reported the 5MWe reactor to have been operational and the ELWR to not have been operational during this month.11 Another interesting observation that can be made with the January 11, 2022, image is the concentrated thermal pattern in the Kuryong River immediately south of the reactors. This is likely an example of how lower water levels during winter months expose and bring rocks and sand in the riverbed closer to the surface, where they more readily heat up and display a stronger thermal pattern. In multispectral imagery, rock and sand are more visible in this shallow spot of the river.
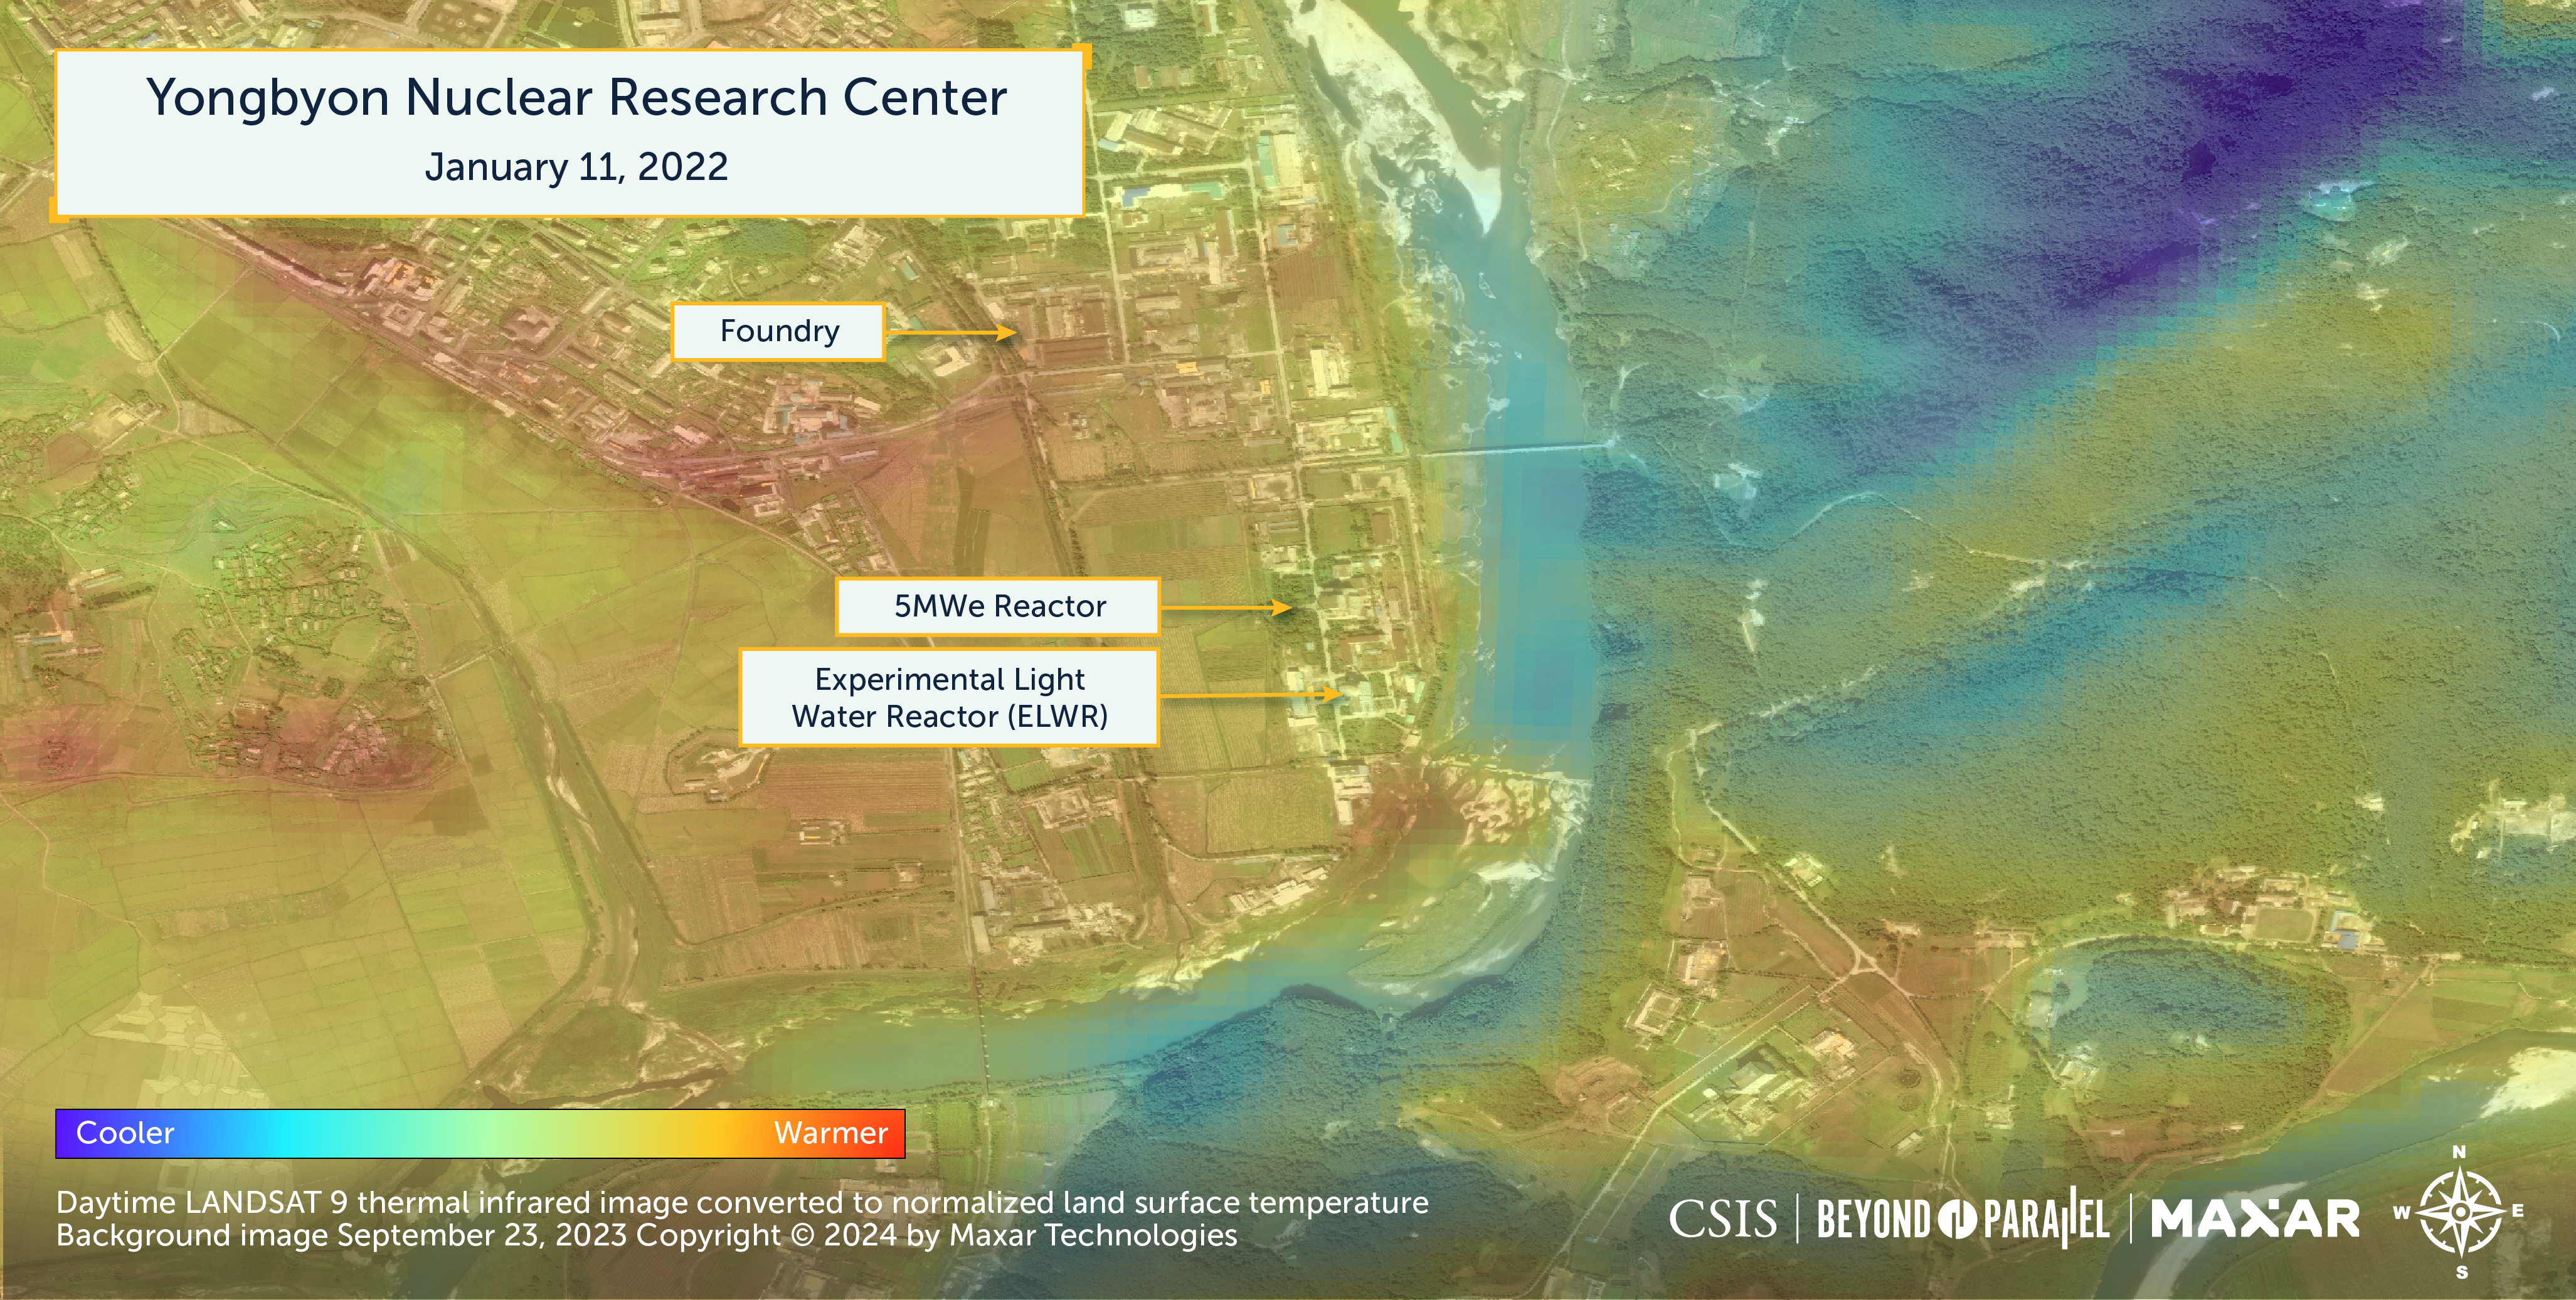
In another instance of when only a weak thermal pattern is observed in imagery when both reactors are known to have been operating, a LANDSAT image from January 9, 2024, shows only a slightly warmer-than-average pattern over the 5MWe reactor.

An example of no distinguishable patterns observed during periods of operation can be observed on February 7, 2023. The UN PoE assessed the 5MWe reactor to have been operational during this time period but not the ELWR.12 Further supporting this assessment was the water discharge observed coming out of the pipe leading from the 5MWe reactor in multispectral imagery taken just three days earlier, on February 4, 2023.13,” RFA, February 17, 2023, https://www.rfa.org/korean/news_indepth/zoominnk-02172023100826.html.] Despite these indicators of operation, there is no distinguishable thermal pattern over the reactor.

The discussed examples naturally lead to the question of why LANDSAT TIR analysis shows weak or no distinguishable thermal patterns over key facilities that are known to have been operational. There are few potential and probable answers. First and most likely, LANDSAT imagery is not sensitive enough to accurately detect the thermal pattern. Second, information from other sources about the dates of operation may not be accurate or not detailed enough. For example, an interruption reported in the middle of a month may refer to an interruption from the 14th to the 17th of that month, which would not be reflected in a TIR analysis with imagery taken on the 13th. Third, heat and resulting thermal patterns take time to build, especially in a concentration that is significant enough for LANDSAT imagery to detect. If a reactor starts operating one day, the thermal pattern is not an instant product but rather will take hours to days to build.
Conclusion
The comprehensive analysis of LANDSAT 8 and LANDSAT 9 TIR imagery over Yongbyon Nuclear Research Center over the past two years reveals the nuanced capabilities and limitations of current commercial satellite thermal imagery in assessing operational status. It underscores the capabilities and limitations of using such TIR analysis in determining the activity levels at nuclear facilities.
While strong thermal patterns have reliably indicated operations without false positives, the occurrence of weak or undetectable thermal patterns during known operational periods cautions against overreliance on thermal data alone. Future analyses should integrate thermal imagery with other intelligence sources to form a more complete operational picture. As we move forward, this research serves not only as a testament to the evolving landscape of satellite imagery analysis but also as a reminder of the persistent need for comprehensive, multi-faceted intelligence gathering in the pursuit of understanding North Korea’s nuclear ambitions.
Appendix
The following is the chronological collection of the closeup images over the central section of the Yongbyon Nuclear Research Center discussed in this report. For a chronological collection of the overview images, see part one. For a chronological collection of the closeup images over the southern section of Yongbyon, see part three.
Base Image Copyright © 2024 by Maxar Technologies. Image may not be republished without permission. Please contact imagery@csis.org.
References
- UNSC, “Final report of the Panel of Experts submitted pursuant to resolution 2627 (2022),” S/2023/171, UNSC, March 07, 2023, Page 7 and 97; Peter Makowsky, Olli Heinonen, Jack Liu, Jenny Town, “North Korea’s Yongbyon Nuclear Research Center: Plutonium Production Continues,” 38 North, July 28, 2022, https://www.38north.org/2022/07/north-koreas-yongbyon-nuclear-research-center-plutonium-production-continues/. ↩
- UNSC, “Midterm report of the Panel of Experts submitted pursuant to resolution 2680 (2023),” S/2023/656, UNSC, September 12, 2023, Page 8 and 81. ↩
- UNSC, “Final report of the Panel of Experts submitted pursuant to resolution 2627 (2022),” S/2023/171, UNSC, March 7, 2023, Page 7 and 99; UNSC, “Final report of the Panel of Experts submitted pursuant to resolution 2680 (2023),” S/2024/215, UNSC, March 7, 2024, Page 7 – 8 and 79-80. ↩
- Sang-jin Cho, “전 IAEA 사무차장 “영변서 ‘삼중수소’ 생산 정황…핵탄두 소형화에 필수” (Former Director General of IAEA says “there are circumstances of ‘tritium’ production, which is essential for nuclear warhead miniaturization, in Yongbyon),” VOA, March 21, 2024, https://www.voakorea.com/a/7536013.html. ↩
- David Albright, Sarah Burkhard, Victoria Cheng, Spencer Faragasso, “North Korea’s ELWR: Finally Operational After a Long Delay,” ISIS, January 23, 2024, https://isis-online.org/uploads/isis-reports/documents/North_Koreas_ELWR_January_2024_Final.pdf. ↩
- Author interview data. ↩
- Peter Makowsky, Jack Liu, Olli Heinonen, “Yongbyon Nuclear Scientific Research Center: Expansion Work Continues,” 38 North, April 28, 2023, https://www.38north.org/2023/04/yongbyon-nuclear-scientific-research-center-expansion-work-continues/. ↩
- Author interview data. ↩
- UNSC, “Final report of the Panel of Experts submitted pursuant to resolution 2680 (2023),” S/2024/215, UNSC, March 7, 2024, Page 8 and 85. ↩
- Jin-woo Shin, “Yongbyon nuclear reactor could yield weapon-grade plutonium,” Dong-a Ilbo, October 05, 2023, https://www.donga.com/en/Search/article/all/20231005/4465804/1. ↩
- UNSC, “Final report of the Panel of Experts submitted pursuant to resolution 2569 (2021),” S/2022/132, UNSC, March 1, 2022, Page 7 and 89; Author interview data. ↩
- UNSC, “Midterm report of the Panel of Experts submitted pursuant to resolution 2680 (2023),” S/2023/656, UNSC, September 12, 2023, Page 8. ↩
- Jong-min Noh, “북 영변 핵시설, 원자로 가동 플루토늄 생산 지속[North Korea Yongbyon nuclear facility, nuclear reactor on operation and Plutonium continues production ↩


